
“Customer experience is the last source of sustainable differentiation and the new competitive battleground.” — Tiffani Bova, Gartner Vice President and Distinguished Analyst.
A statement that’s easy to agree with but varies in its application. After all, what does it mean to be customer-centric? What weapons can you bring to this battlefield? In a world fueled by data, so powerful that it can make or break a company, I believe that it has the potential to act as the ultimate ammunition for achieving customer-centricity.
Is Data Integration a Necessity?
Three years ago, Forrester reported that by 2016, the average company would be using 66 different SaaS applications. Even more revealing than app growth was a survey by Salesforce that predicted by 2020, the number of analyzed data sources will rise by 83 percent!
By 2020, the number of analyzed data sources will rise by 83 percent!
If you think of this evolution in terms of our ability to understand and optimize the customer experience, your initial reaction might be, “Great! We’re harnessing more tools to collect and analyze customer data than ever before. We must have a better grasp on the customer journey.” Unfortunately, reality rings far different. In fact, a study of marketers found that just six percent of those surveyed had achieved a single customer view. The lesson? We’re collecting more data, from more sources and applications than ever before, but most have failed to develop a strategy tying it all together.
Only six percent of marketers have achieved a single customer view
Instead, the information about our customers, the breadcrumbs that make up their experience, is spread across literally hundreds of sources. Each department can tell a chapter of the story by leveraging the data at their disposal, but the organization is lacking the cohesion of an end-to-end novel. If we’re at war, and customer experience is the battleground, can you compete without achieving a unified customer view? Can you deliver an unparalleled customer experience if you cannot visualize and optimize every touchpoint within that experience?
We’re at war and customer experience is the battleground-can you compete without a unified customer view?
If your answer is “no” and solving this dilemma is a priority, there is hope. Dozens of solutions have risen over the last few years to address this very problem. A simple Google search for “data integration” will deliver more than 15 million results that may sound similar but play very different roles. To identify the best possible solution for your organization, we’ve broken down the types of tools you’ll encounter in your evaluation process and the pros and cons of each.
Peeling the Data Onion
Data Warehouses
Most organizations rely on a data warehouse and many have moved to cloud-based solutions such as Amazon Redshift, Snowflake or TeraData. I like to think of the data warehouse as the core of the onion, the inside central nervous system that stores your data and keeps it organized for accessibility and retrieval.
Data warehouse is the core of the onion, the inside central nervous system that stores data and keeps it organized
Pros:
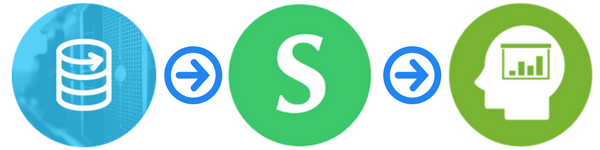
These tools are excellent for storing sizable volumes of information. They’re affordable, scalable and well-suited for engineers who need a data lake that they can pull from and reference. Most engineers don’t have the time or resources to build and easily maintain information stored in their data warehouse. To take the burden off their shoulders, solutions such as Segment can be leveraged to connect and load data seamlessly. This speeds up queries and enables engineers to maintain control of their raw data while expediting the synchronization process.
If you wanted to create your own home-grown analytics solution, you could potentially combine a data warehouse, a data piping tool such as Segment and a data visualization solution layered on top.
Cons:
Aside from the tremendous effort that would be required on the engineering side to build an integrated analytics solution from scratch, a pieced together strategy would still lack automated real-time capabilities and the granularity of individual-level reporting. It also would be geared toward engineering and would be difficult for other employees in the organization to seamlessly access, analyze and segment their data in an easy to use interface. So, while data warehouses are perfect for housing volumes of information, to actually do anything with that information you’ll need to add additional layers to the onion.
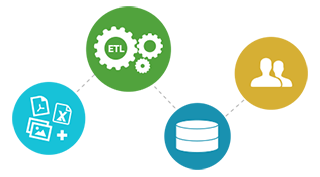
ETL Tools
If you’ve heard the term ETL (extract, transform and load), it is the process by which you can access information within data warehouses by running queries, transforming it into the right aggregations, migrating the results and loading it into another tool for analysis. Solutions such as Mulesoft and Informatica streamline this process by leveraging APIs to connect the data between an organization’s applications and devices.
Pros:
If it’s not a necessity for data to be integrated in real-time, you can batch data synchronization to save time on pulling queries and avoid API call limits. For example, you could extract data from an internal MySQL database, transform it into a language that a tool (like Salesforce) can read and push it into the application in single batches. This has the potential to add a whole new dimension to existing application data and can help organizations integrate without exceeding specified request limits.
Cons:
The procedure itself is time-consuming and tedious, hence its impending doom. It demands exhaustive effort to leverage ETLs, data isn’t pushed in real-time and often the platform at the receiving end of the data (in the above example, Salesforce) is not equipped to handle the data that you’re contributing. Emerging data systems today are leaving the data in one place rather than extracting and transforming the data where it sits. In any case, the process and ETL tools are still widely used in more traditional systems so understanding what they are and how they’re used is beneficial when evaluating solutions.
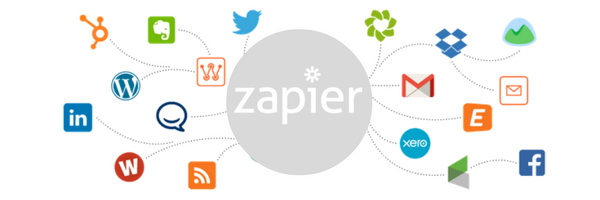
API Connectors
Tools like Zapier and Automate act as data glue. They allow you to leverage APIs to send information to and from tools or services with customizable triggers and webhooks.
Pros:
These solutions are suited for healing small problems between specific applications. For example, let’s say you want to inform your support team when a customer has made a payment. You could setup a rule in Zapier to automatically update the customer profile in your support application, such as Zendesk, to show that a payment has been made.
Cons:
API connectors are like band-aids, designed to solve small pieces of the data integration ailment. Similar to wrapping a broken foot in an ice pack when it actually needs a cast. You might feel better for a while, but the long-term problem doesn’t go away.
API connectors are like band-aids, designed to solve small pieces of the data integration ailment
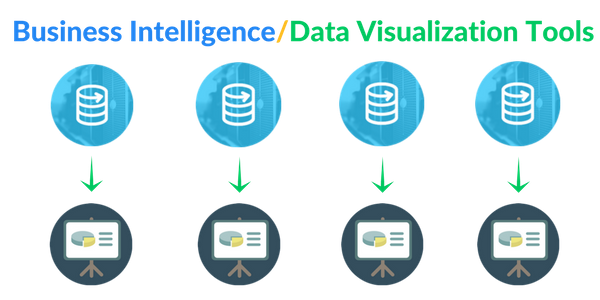
Data Visualization and Business Intelligence Tools
Who doesn’t love beautiful charts, graphs and colors that bring your data to life? The term Business Intelligence (BI) and Data Visualization are often interchanged synonymously with one another. Solutions like Domo and Looker allow you to visualize data from disparate applications within a single platform. You can access, often real-time, information and compare data sets between departments and teams.
Pros:
Layering your data warehouse with a BI tool would enable you to quickly identify trends within individual sets of data and seamlessly report on defined metrics and KPIs. If you think of the existing applications that you’re using, each probably has its own set of analytics housed within that tool. BI is like taking the analytics for each of those and displaying them side by side.
Cons:
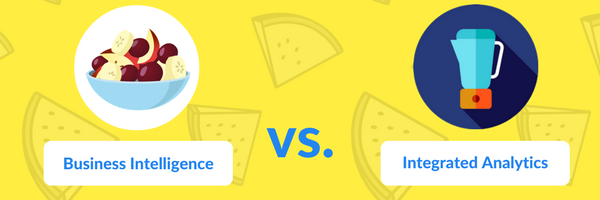
While these solutions may promise to be the answer to all of your data integration problems, they’re missing a very key element. The data itself does not integrate. Let me explain. Imagine you’re making a fruit salad. In this salad, you’ve placed bananas, strawberries, orange slices, grapes and kiwi in a bowl. The fruit sits neatly together in the bowl and you can examine all of the colors and varieties next to one another. But, what if you wanted to taste a combination of bananas, grapes and kiwi? To do this, you would need to throw that fruit salad into a blender and make a smoothie.
If the fruit were sources of data, the bowl would be the BI platform. But, to truly integrate, to see how one source impacts another, to combine the flavors of data, you’ll need a blender. And, in this fruity metaphor, the blender is the Analytics Solution.
Analytics Solutions
Choosing the right analytics tool for your business is no easy task. Most solutions share common features such as retention and cohort analysis, segmentation and customer identification. Many offer some form of application integration to tie in data sources for comparison across tools. When seeking a unified customer journey, an integrated analytics solution should include three essential elements:
Real-time data consolidation that acts as a blender, rather than a bowl — allowing you to combine siloed data and visualize every touchpoint within the customer journey.
Collaborative reporting capabilities that make the sharing and accessibility of data so seamless that every employee is empowered to make data-driven decisions.
Actionable insights that can trigger automated messaging, workflows and events based on a user’s behavioral, demographic and psychographic data.
Pros:
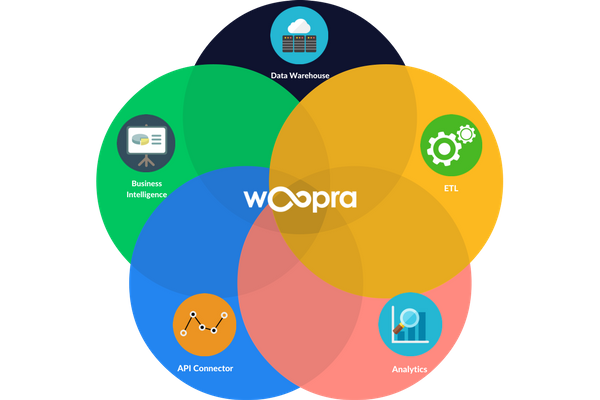
Solutions like Woopra are designed to consolidate all disparate data sources within a single hub. Think of it as a data warehouse, ETL, API connector, business intelligence and analytics tool rolled into one. The platform was built to empower every employee with integrated data so that they can visualize how their actions impact the customer experience and make real-time decisions, fueled by data. It enables organizations to visualize every touchpoint in the customer lifecycle and take real-time actions to optimize that journey, creating a cohesive and unparalleled customer experience.
Cons:
Other analytics solutions, such as Mixpanel and KISSmetrics, are well-suited for solving very specific pieces of the analytics puzzle. For example, Mixpanel offers advanced mobile and application analytics. But, today’s consumers interact with your brand in far more ways than browsing their mobile devices and engaging with your application. To engrain customer-centricity into our organizations, we must see the world as our customers do. Not as a set of touchpoints or sources but as an interconnected experience. Solutions that only focus on a few chapters of the story will leave gray areas that today’s connected consumer is sure to fall into.
To engrain customer-centricity into our organizations, we must see the world as our customers do
Conclusion
Whatever tool (or combination of tools) you choose, take the time to understand your unique business needs and make data integration a business priority this year. Only then will you achieve a unified customer view and be prepared to fight with loaded ammunition on the customer experience battleground!